You want to investigate planetary motion, but you cannot measure the orbit of Mars yourself. You find reliable figures from NASA and begin planning a mathematical model. Then someone tells you that your IB Mathematics internal assessment needs a survey or experiment to demonstrate personal engagement.
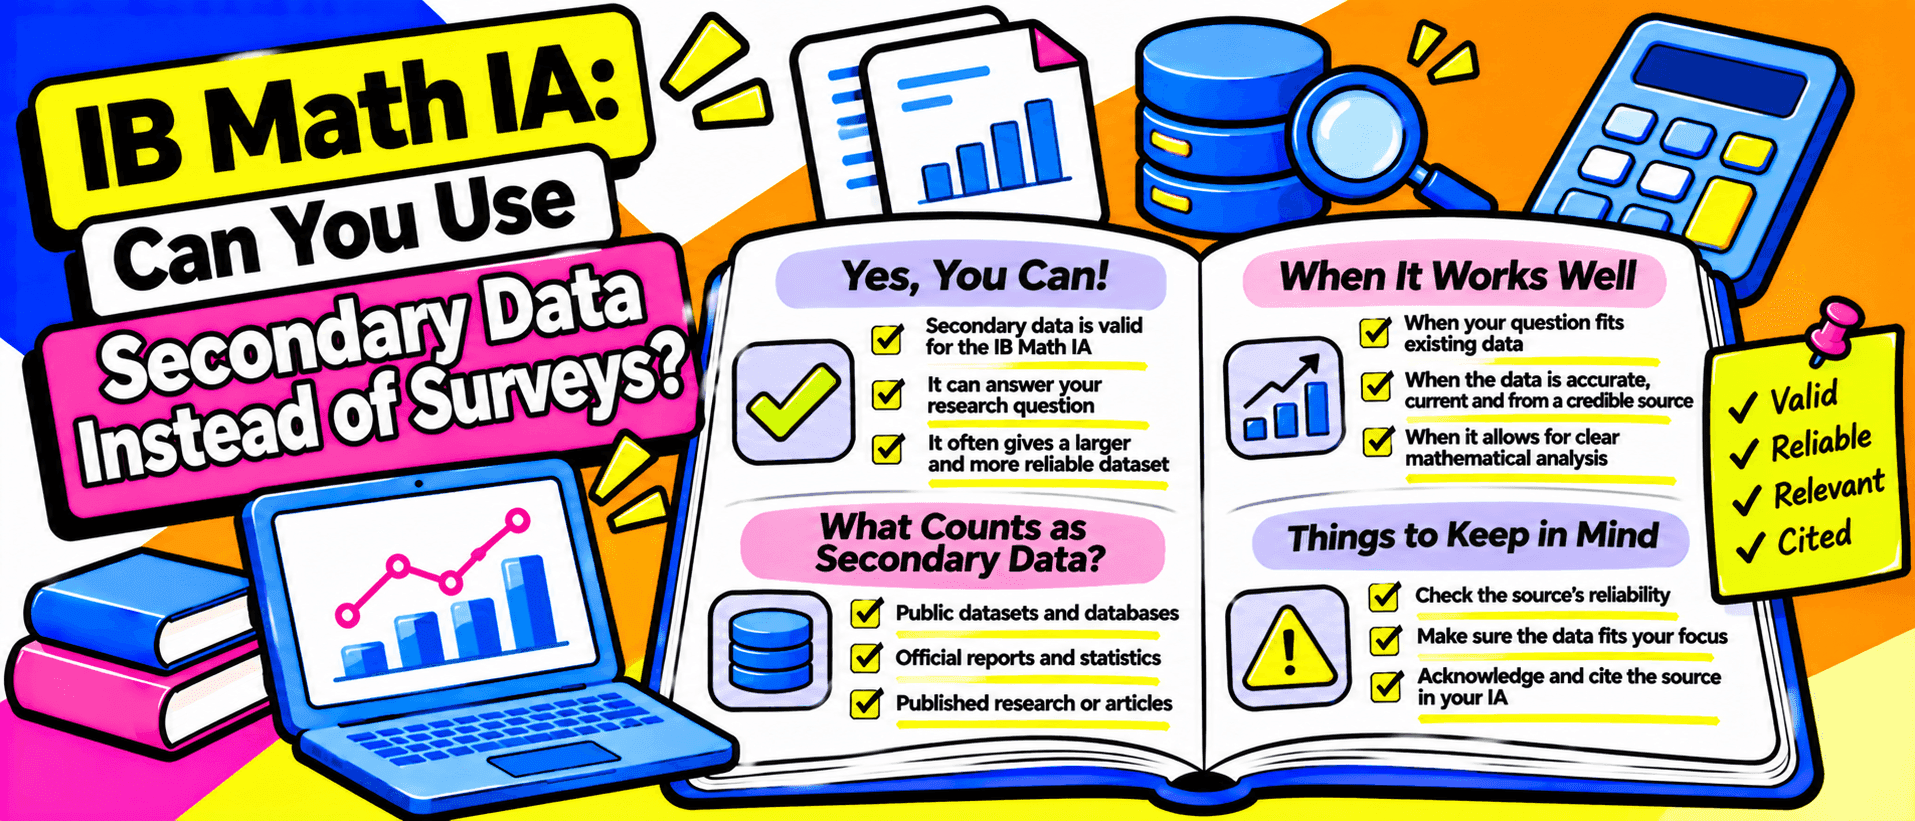
That advice confuses collecting data with exploring mathematics. IB Math IA secondary data can provide an appropriate foundation for an original investigation. The important questions are whether the dataset is credible, the mathematics suits your research question, and your decisions are visible in the finished exploration.
The concern is familiar. In a January 2026 r/IBO discussion, a student planning to investigate Kepler's laws using NASA data worried that not collecting observations personally would weaken the IA. Here is what the IB guidance supports and how to build a worthwhile investigation using existing information.
Does the IB Math IA Require Primary Data?
No universal IB mathematics requirement says every student must collect primary data. A mathematical exploration may involve modelling, statistics, geometry, theoretical reasoning or another mathematically focused approach. Primary data means information you collect yourself, such as survey responses or measurements. Secondary data means information collected or published by another organization or researcher.
The IB Diploma Programme mathematics curriculum describes both Analysis and Approaches (AA) and Applications and Interpretation (AI). Their emphasis differs, but neither turns a student survey into a universal condition for the exploration.
The IB Mathematics: Applications and Interpretation guide describes the IA as a student-selected mathematical exploration focused on the relevant mathematics. Its requirements include authentic work, appropriate mathematical communication and acknowledgment of external material. It does not impose primary collection as a blanket rule.
Your teacher can still provide methodological guidance and may ask you to justify your choice. Discuss any school-specific instructions early, but distinguish those instructions from a universal IB assessment rule.
Does Secondary Data Count as Personal Engagement?
For examinations through November 2028, the current mathematics criteria include Criterion C: Personal Engagement. The IB describes this as making the mathematics your own through independent thinking and exploration, not merely showing how much work you completed.
You might demonstrate that engagement by choosing an unusual comparison, proposing and testing a prediction, deriving a model, investigating an unexpected pattern or explaining why you rejected one method in favour of another.
For example, downloading a NASA table and reproducing a published graph is not much of an exploration. Selecting orbital measurements, independently testing a relationship, checking residual errors and evaluating assumptions gives the reader more evidence of your own mathematical thinking. A lengthy personal story cannot replace this work.
The criteria change for first assessment in May 2029. The IB has announced four criteria for the updated mathematics courses: problem specification, abstraction, computation and interpretation. Personal engagement is no longer a separately named criterion. Independent decisions still matter, particularly when students frame a problem, select data and methods, and evaluate their solution. Check the rubric for your examination session rather than applying old criterion labels to new coursework.
Three Credible Sources for a Secondary Data Math IA
A reputable website is a starting point, not a finished research question. Look for clear definitions, units, time periods, collection methods and enough observations for the mathematics you plan to use.
| Field | Source | Possible mathematical investigation |
|---|---|---|
| Astronomy | NASA Planetary Fact Sheet | Model orbital period against orbital distance |
| Economics | World Bank World Development Indicators | Compare a chosen economic indicator across years or countries |
| Environment | NOAA Climate Data Online | Model seasonal temperature or rainfall patterns at a station |
These are research possibilities, not guaranteed IA topics. Each needs a precise question, a suitable mathematical method and realistic limitations. Check that the data you actually need are available before committing to the investigation.
Worked Example: Exploring Kepler's Law With NASA Data
NASA's explanation of Kepler's laws states that the square of an orbital period is proportional to the cube of the orbit's semimajor axis for planets orbiting the same central body. You can investigate how closely published planetary observations follow that relationship.
Use T for orbital period and a for semimajor axis. The model is T² = ka³, where k is constant for orbits around the same central body under the model's assumptions. NASA's planetary fact sheet provides orbital periods in days and average distances from the Sun in millions of kilometres. NASA identifies that distance measure as the semimajor axis.
A small, sourced selection is:
| Planet | Period, T (days) | Semimajor axis, a (million km) |
|---|---|---|
| Mercury | 88.0 | 57.9 |
| Venus | 224.7 | 108.2 |
| Earth | 365.2 | 149.6 |
| Mars | 687.0 | 228.0 |
Normalize both variables relative to Earth. For Mercury, T/365.2 ≈ 0.241 and a/149.6 ≈ 0.387. Squaring the first gives about 0.0581, while cubing the second gives about 0.0580. The closeness is consistent with the predicted proportional relationship, allowing for rounded source values.
That calculation is only a starting point. You could plot T² against a³, estimate a gradient, investigate residuals or compare your empirical constant with a theoretical value, provided you understand and justify the mathematics. The source data already reflect established planetary science, so fitting them does not constitute an independent proof of Kepler's law.
To make the exploration more individual, ask what changes when you include outer planets, change units or examine the effect of rounded measurements. Explain why you make each choice. Avoid presenting the same graph and conclusion available in a textbook as though they were original discoveries.
Economic and Environmental Data Can Work Too
For an economics topic, the World Bank's World Development Indicators provide downloadable series and documentation. A student interested in development might examine the association between two clearly defined indicators across a selected group of countries. Another could compare how one indicator changes over time.
Decide whether correlation, regression or a growth model answers your question. Countries may have different reporting years, and an observed association does not establish causation. A thoughtful IA explains such restrictions instead of hiding them.
For an environmental topic, NOAA Climate Data Online supplies historical weather observations, including temperature and precipitation records. You might compare monthly mean temperatures with a periodic model, then evaluate seasonal residuals. However, missing station records, changing observation practices and unusually extreme months can affect the fit.
These projects become mathematical when you build, test and interpret an appropriate model. Merely describing economic trends or explaining climate change would not be sufficient mathematical exploration.
How to Turn Existing Data Into Your Own Investigation
Start with a question that can be answered mathematically. “NASA and planets” is a topic, not a research question. “How closely does a model of squared orbital period against cubed semimajor axis fit selected planetary observations?” identifies variables, a model and a measurable outcome.
Next, document your dataset. Record the original publication, its date or version when provided, the access date, variables, units, inclusion criteria and any cleaning steps. Keep a copy of the raw values before transforming them.
Then select the mathematics. Explain why you need each calculation. A sophisticated technique used without understanding may be less valuable than a simpler method applied carefully, explained accurately and evaluated critically.
Finally, make your choices traceable. If you select four planets rather than eight, explain the reason. If you exclude a missing economic observation, document it. If a model gives poor predictions, discuss why rather than silently changing the dataset. Your choices help turn a public dataset into an independent exploration.
Limitations You Must Discuss When Using Secondary Data
The greatest risk is treating published numbers as unquestionable. Even reliable institutions use conventions, estimates and measurement procedures that affect what the data mean.
An astronomical comparison can be influenced by rounding and assumptions about two-body orbital motion. Economic indicators may be revised, adjusted for inflation or defined differently across countries. Weather station records may contain gaps or changes in station location.
Separate the quality of the data from the quality of the mathematical model. A precise dataset cannot rescue an inappropriate equation, and an elegant regression cannot remove sampling bias or establish causation.
Consider sensitivity testing: would your conclusion change if one observation were excluded for a documented reason or a different reasonable time interval were used? Report the original result alongside the comparison. Do not remove inconvenient points merely to improve a correlation coefficient.
What If Your Teacher Insists on a Survey?
Bring a one-page proposal, not just an argument. Include the research question, original source links, a sample of the variables, planned mathematics, and ways you will demonstrate independent decisions and reflection. Ask which assessment requirement the proposed survey would help you satisfy.
A survey can be appropriate for questions about students' experiences, but it would be a poor substitute for professionally measured planetary or climate observations. Explain the methodological advantage of existing data while remaining open to your teacher's feedback on scope and mathematical depth.
Final Checklist Before Choosing Secondary Data
- My research question requires mathematical investigation, not just description.
- I can trace each value to a credible and clearly cited source.
- I understand what the variables, units and measurements represent.
- I have independently chosen and justified the mathematical methods.
- I can evaluate limitations, assumptions and alternative approaches.
- I will acknowledge external data and keep my work authentic.
- I have checked the assessment criteria for my examination session.
Final Thoughts: Original Thinking Matters More Than Original Collection
You do not need to survey classmates to make your IB Mathematics IA personal. Secondary research in a maths exploration can provide reliable observations while leaving you responsible for the question, modelling, mathematical reasoning and evaluation.
Use NASA, World Bank or NOAA data because they help answer a question you genuinely want to investigate, not because they offer easy graphs. The strongest argument for your chosen method is visible in the quality and independence of the mathematics itself.
Table of contents
Share
Related reading
- IB Math AI SL IA: What If Your Data Has No Correlation?Your IB Math AI SL IA shows no correlation? Learn to interpret Pearson and Spearman results, evaluate limitations, and write an honest, rigorous conclusion.
- Can IB Math AI HL Get You Into Computer Science in 2027?Can IB Math AI HL get you into Computer Science? Compare 2027 university entry rules at Oxford, UCL, Cambridge and more to choose your subjects confidently.
- IB Math AA HL vs AI HL: Economics Entry RequirementsCompare IB Math AA HL and AI HL for economics degrees. Check verified 2027 entry requirements at Cambridge, LSE, Oxford, UCL and more before choosing.
- MYP Maths Criteria A to D: What Each Band Really MeansLearn MYP Maths Criteria A to D with worked examples for every band, the right year rubric, and practical ways to improve your performance on the next task.
- Choosing MYP 4 and 5 Subjects to Keep DP Options OpenExplore how MYP 4 and 5 subject choices connect to DP courses. Check maths pathways, school entry rules and flexible options before choosing your subjects.