Introduction to Scatter Diagrams
When we want to explore the relationship between two variables — like hours of sleep and exam performance, or temperature and ice cream sales — we use bivariate data. A scatter diagram (or scatter plot) is the standard tool for visualising this kind of data.
A graphical representation of bivariate data where each data pair is plotted as a single point on a coordinate plane, with one variable on each axis.
Data involving two variables measured on the same subject or unit, allowing us to investigate possible relationships between them.
To construct a scatter diagram:
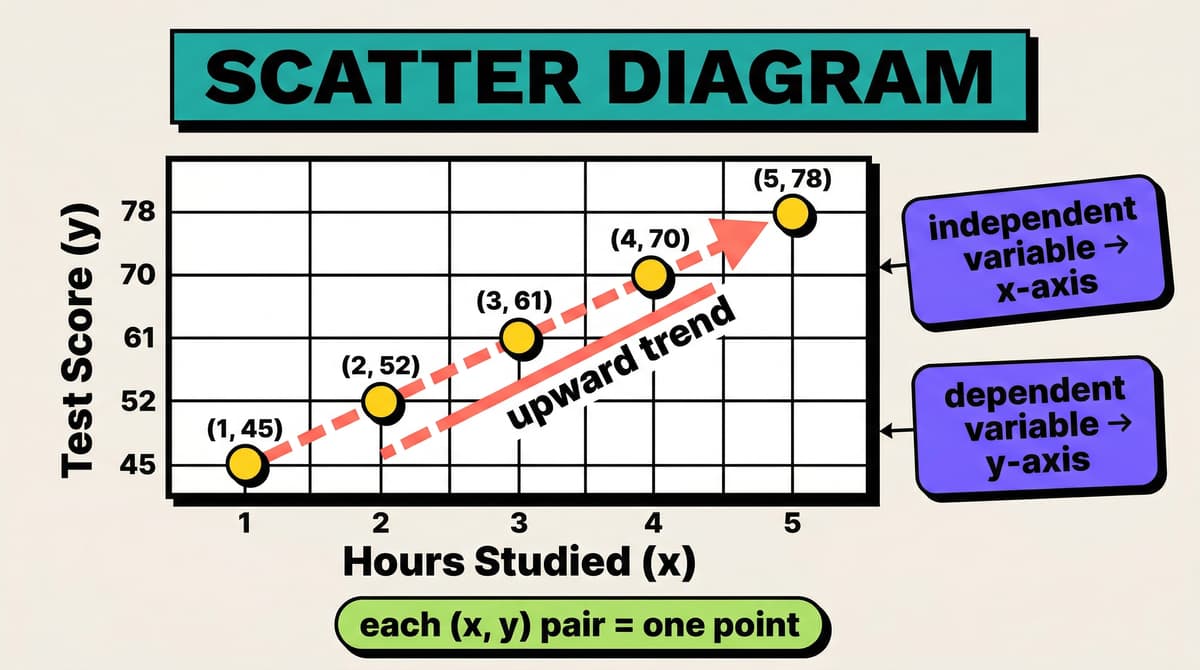
- Decide which variable is the independent variable (plotted on the -axis) and which is the dependent variable (plotted on the -axis).
- Choose appropriate, consistent scales for both axes.
- Plot each pair as a point.
- Label both axes with variable names and units.
Scenario: A teacher records the number of hours each student studied and their test score (out of 100).
| Hours studied () | Test score () |
|---|---|
| 1 | 45 |
| 2 | 52 |
| 3 | 61 |
| 4 | 70 |
| 5 | 78 |
Each row becomes one point on the scatter diagram. The -axis shows hours studied; the -axis shows test score. Plotting these five points reveals a clear upward trend.